Visits
In short
Branch-level visit counts with member share. For each branch, you'll see total visits, member-attributed visits, the percentage of visits going through identified members, and the share of total visits each branch represents. The transaction-count counterpart to the Sales report.
The Visits report answers "how many transactions happened, where, and how many were member-identified." Use it alongside Sales to separate "member share is low because fewer members transacted" from "member share is low because member baskets are smaller."
What you'll see
Required filters:
- Purchase Date — date range (typically is in the last 30 days).
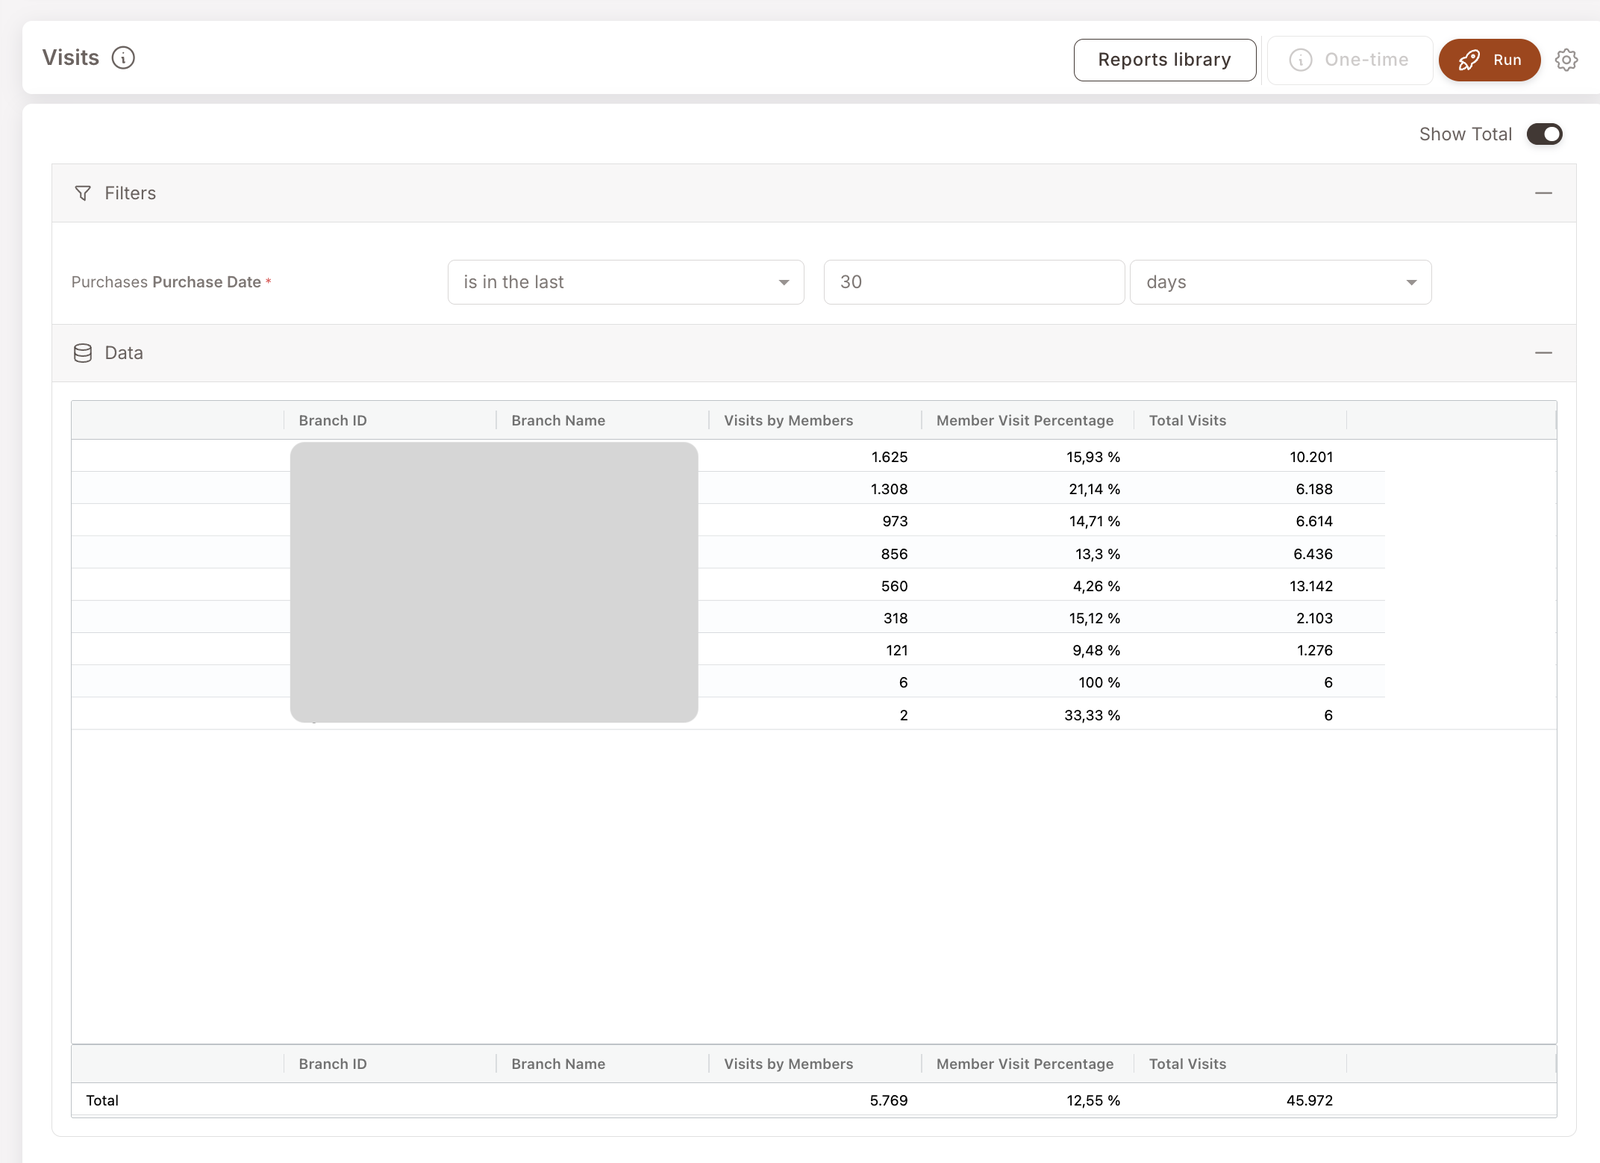
Data columns (per branch):
- Branch ID / Branch Name — the branch.
- Visits by Members — count of transactions where the cashier attached an identified member to the check.
- Member Visit Percentage — member share of visits at this branch (Visits by Members / Total Visits).
- Total Visits — total transactions at this branch in the period.
A Show Total toggle in the top-right adds a Total row that sums across all branches.
When to reach for this report
4 common use cases
- Branch comparison on traffic. Which branches see the most visits? Which have the highest member share? Often the high-traffic branches don't have the highest member %.
- Cashier-flow audit. A branch with high visit volume but low Member Visit Percentage often has an identification problem at the till — see How members and non-members are tracked.
- Weekly check-in. Set the date range to the last 7 days, scan the branches. Anything unusual — a sudden drop, a sudden spike — is worth an investigation.
- Sizing the audience for a branch-targeted Smart Campaign. Before launching a Deal at a specific branch, this report tells you how much traffic that branch typically sees in the period.
What to do with the result
Follow-on actions
- Pair with Sales. Visits + Sales gives you average basket value per branch (Sales / Visits). High-value branches with low member share are the highest-leverage place to fix identification flow.
- Branch-targeted Deal. If a branch has high traffic but low member share, a Deal scoped to that branch can drive identification (members get a discount only if they're identified at that branch). See Deal overview and the Happy Hour playbook.
Related reports
- Sales — same shape but counting revenue, not transactions.
- Member purchases — drill into the actual transactions.
- Punch — punch-card-specific branch activity (subset of all visits).